 Check out our latest interactive map showing the location of oil and gas industry “incidents” reported in Montana from 2015 to the present.
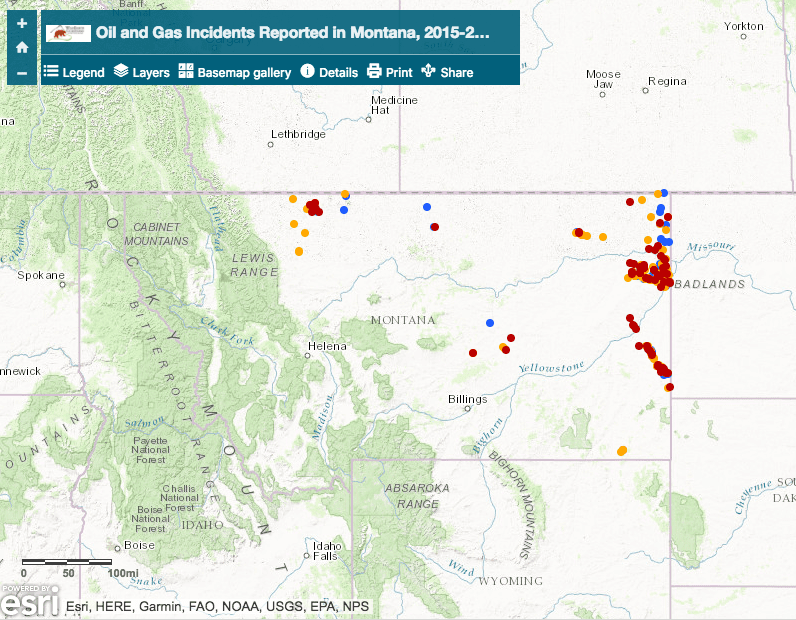
This map was created using data reported by industry to the Montana Board of Oil and Gas. All told, 202 incidents have been reported since 2015. That amounts to around 1.5 incidents per week reported by industry.
Among the biggest reports of incidents? Continental Resources, Inc., Denbury Onshore, LLC, and XTO Energy, a subsidiary of Exxon.
You’ll remember that Exxon was responsible for a massive oil spill in Montana’s Yellowstone River back in 2011. That spill unleashed 63,000 gallons of oil fouling 85 miles of the River and led to a $12 million fine (which, as was widely pointed out, is a drop in the bucket for Exxon and nothing short of a slap on the wrist).

This “inicident” data confirms the dirty truth of oil and gas development and fracking, which is that it’s the norm–not the exception–for things to go wrong. It is regular and commonplace for there to be spills, fires, discharges, and other “undesirable events.” While industry goes to lengths to deny these dangers and risks, it’s irrefutable that companies simply can’t be trusted to get it right.
As a side note, this information was surprisingly difficult to find on the Board of Oil and Gas’s website. I say surprising because this kind of information should be easy for the public to access and understand, especially given the implications of these incidents. All the reports indicate a risk to public health and the environment. Frankly, this information should be right on the homepage of the Montana Board of Oil and Gas.
If you’d like to access the underlying data (and you should if you’re curious), follow these instructions:
- On the Montana Board of Oil and Gas’s website, click on the “Hearing Information” tab near the top of the page.
- On the left hand side of the “Hearing Information” page, click on the “Hearing Files” link.
- The “Hearing Files” page has files organized by year. Incident reports seem to be available only from 2015 onward. Go ahead and click “2015” and you’ll see a list of links to meetings.
- At every meeting, incidents are reported, but if you want an annual summary, click on the link to the December meeting. Go ahead and click on link to the “2015_12” meeting.
- This page presents a list of documents that were presented at the hearing. Among them is an Excel file named “2015_12 Incidents.xls.” Click on that and you’ll get your data for 2015. Do the same thing for other years if you’d like to access more data.
In the meantime, we’ll keep this map updated as more incidents are reported.